What is an infographic? According to Dictionary.com, an infographic is “a visual image, such as a chart or diagram used to represent information or data.” Students in sixth grade literature recently read an article published in Scholastic Scope magazine titled “The Truth About Binge-Watching.” The article addressed issues related to the practice of watching multiple episodes of a television show in rapid succession – a relevant issue as Americans seek to fill their time while under stay-at-home orders. After reading the article, the students created infographics communicating what they learned about binge-watching.
Using websites recommended by their teacher, the sixth graders took the information they gained while reading the non-fiction article and designed their infographics to answer these questions:
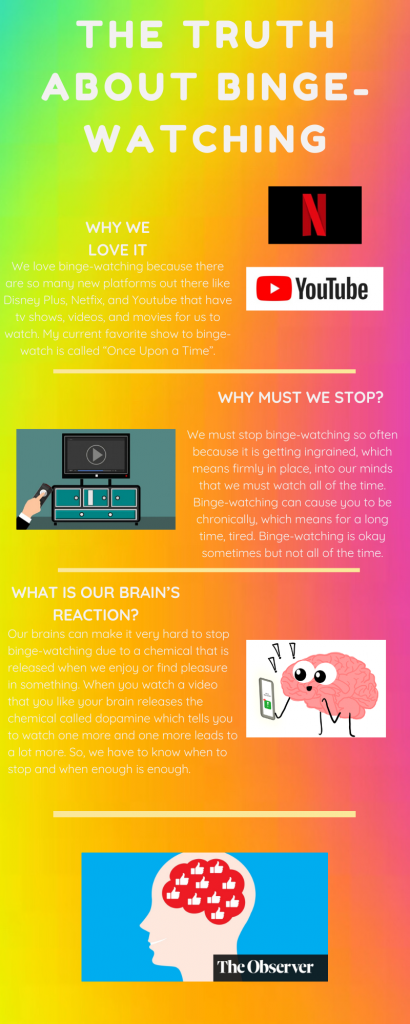
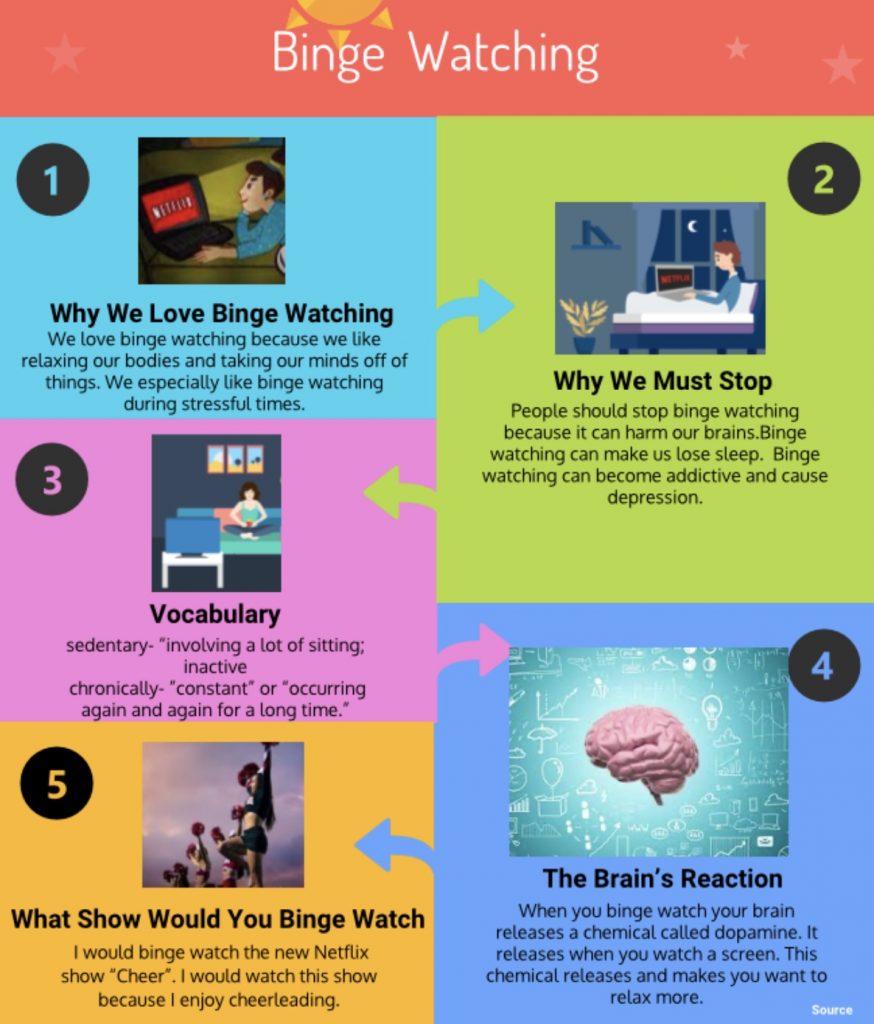
- Binge-Watching: Why do we love it?
- Binge-Watching: Why must we stop it?
- Binge-Watching: How does the brain respond to binge-watching?
- Binge-Watching: Include two vocabulary words and definitions in your infographic.
- If you were to binge-watch, what show would you pick?
The infographics that the students designed succinctly describe how binge-watching can become a habit that leads to mental and physical unhealth. The brain’s response to binge-watching is often to release the neurotransmitter dopamine, which signals to the brain that the current activity is good and worth repeating. Learn more about the cost of binge-watching from these designs by Shelle Pinkard’s sixth grade students!